The trend has edges. We trade them.
REGRESSION CHANNEL
A regression channel is a statistical trend line drawn through a stock's price over time, with bands above and below marking how far price normally strays from that trend before snapping back. When price stretches down to the lower edge and starts recovering, that's the setup.
In other words, think of a stock's price like a tide — it drifts between a high line and a low line, and when it stretches out too far toward the low line, it tends to come back in. A regression channel is just that high line and low line, drawn on the chart. When price reaches the low edge and starts turning back, that's the setup we're watching for.
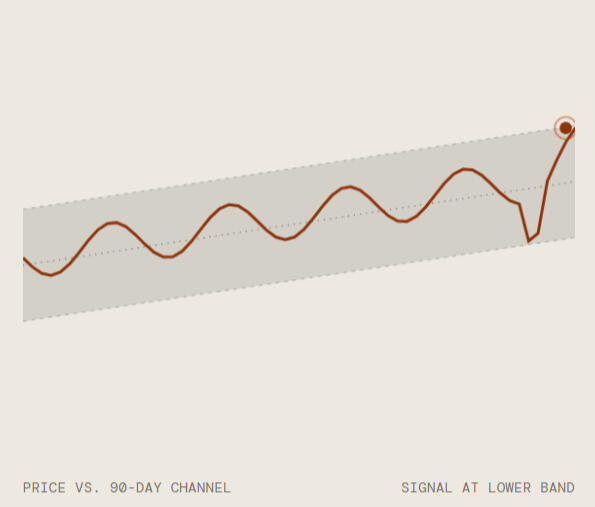
This setup is watch by me manually, sometimes for days, before I send it. I'm not publishing the moment a line crosses. I'd rather wait until I actually believe it, whether that takes two days or two weeks. If it's just chopping sideways, it doesn't go out at all.When you do receive it, it comes with details on where to enter the trade, what to be watchful for, and finally where the recommended exit point is.
Part of Zara · Free while the live record develops.
THE SIGNAL
One published setup, fully decoded.
ABBV — published August 16Entry 250 (last traded price) · Stop 240 (support at 241, confirmed by the 50-day EMA) · First target 261 · Second resistance 267.47 · Eventual exit 282.62
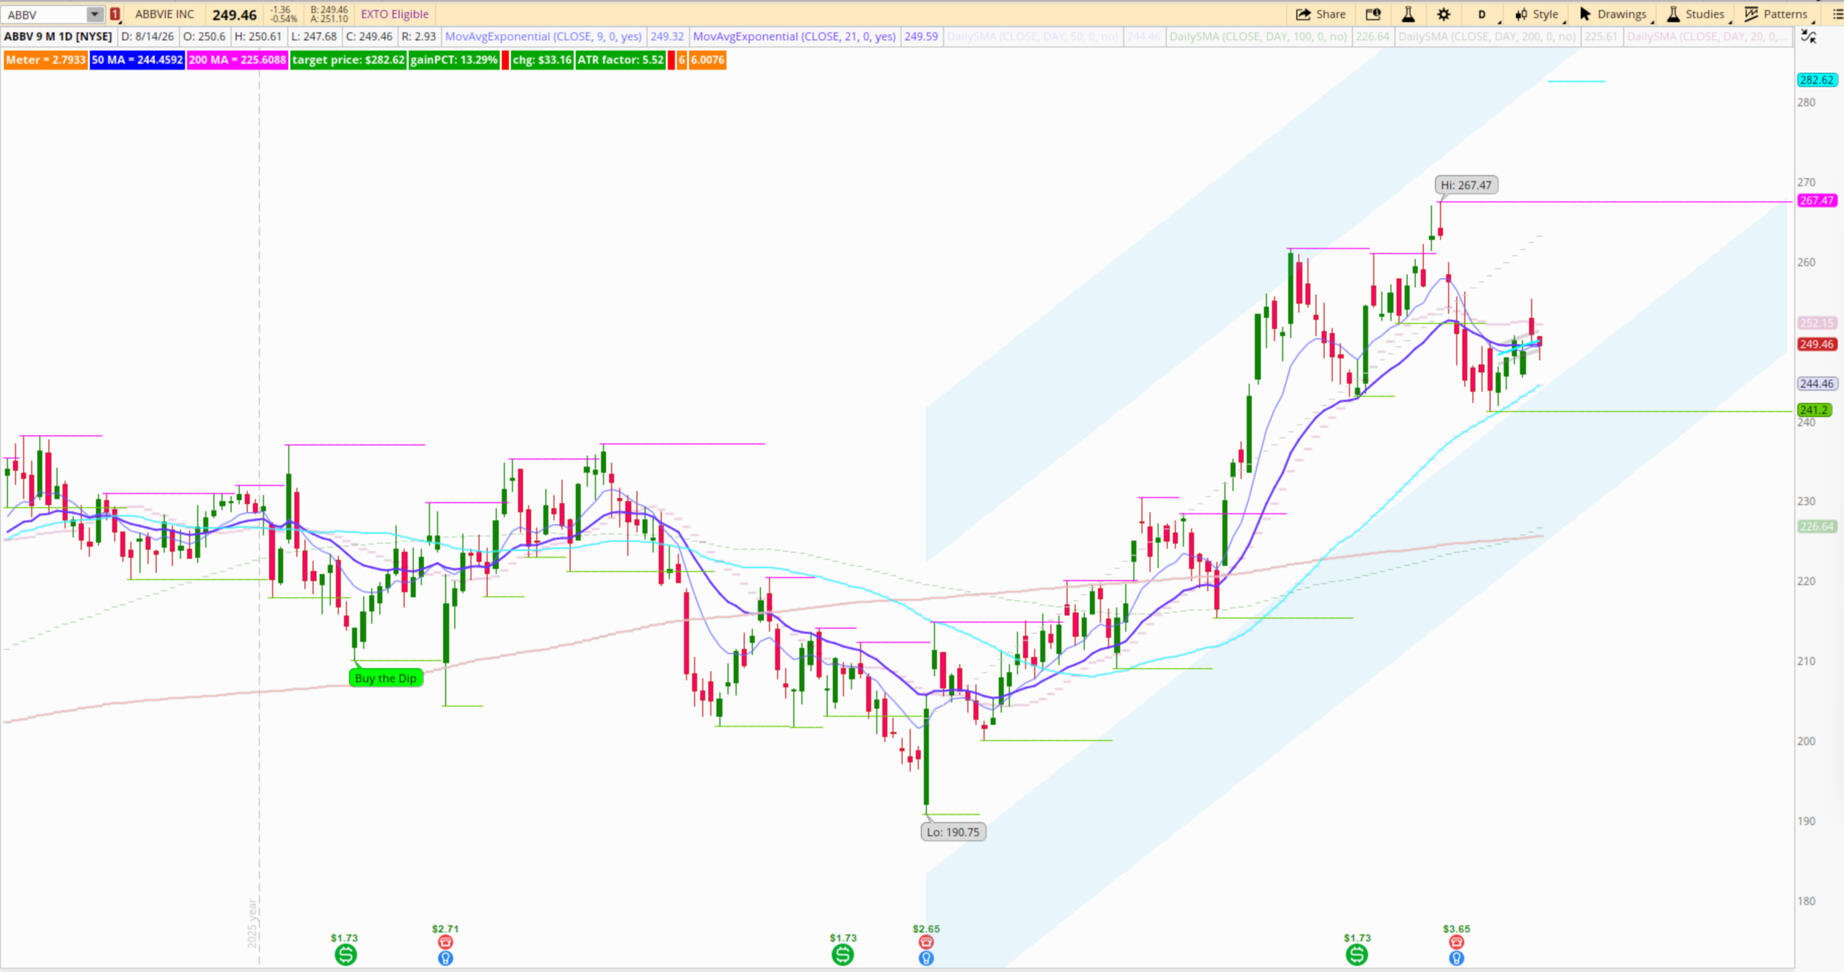
Previously published example. Not a current recommendation.
HOW TO TRADE IT
What you'll actually receive, and what to do with it.
When a setup is ready, you get an email with a ticker and four numbers: entry, stop, target, and eventual exit. Here's what each one means, and what to actually do at each step
Support and resistance, in plain terms
Support is a price level where a stock has tended to stop falling and bounce back up in the past. it's the floor.Resistance is a price level where a stock has tended to stop rising and pull back. it's the ceiling.These aren't guarantees, just levels that have mattered before. The stop is set just below support; the target is set at the nearest resistance above.
What the numbers mean
Entry: the price to buy at.Stop: the price where the setup has failed. If price falls to here, you sell to limit the loss. This is your exit if the trade goes wrong.Target: the first price where you can take profit. This is your exit if the trade goes right, sooner.Eventual exit: the top of the price channel. If the stock keeps climbing past the target instead of reversing, this is where you exit instead. the trade isn't meant to be held past this point.
How much to buy
Don't buy a fixed number of shares. Based on your account size, your trade will dictate how much money you're willing to risk. A common starting point is 1% of your account.So if your account size or the total value is $20,000, the amount you risk per trade should be around $200.
Shares = (Account × Risk%) ÷ (Entry − Stop)
Example 1:
$20,000 account, 1% risk on the ABBV setup (entry 250, stop 240, risk $10/share):
$20,000 × 1% = $200 risk → $200 ÷ $10 = 20 shares ($5,000 position)
Example 2 :
$50,000 account, same trade:
$50,000 × 1% = $500 risk → $500 ÷ $10 = 50 shares ($12,500 position)
Same rule, same trade, different account size — the dollar risk stays proportional, the share count doesn't.
How to place it
Buy the shares at (or near) the entry price. Then immediately set an OCO order. OCO is 'One-Cancels-the-Other' where you place the stop and target placed together. Your broker will automatically sell whichever price is hit first. You don't need to watch the trade live.
How the trade ends? this is not a buy-and-hold
Every trade here has a defined exit. It ends one of three ways:a) your stop is hit and you're out with a small loss,
b) your target is hit and you're out with a gain, or
c) price keeps climbing past the target, in which case you exit manually at the eventual exit level rather than letting it ride indefinitely.This is a swing trade with a plan, not a long term investment and not a position you buy and forget about.
What if I'm late to a signal?
Check how much room is left to the first target versus how far price has already moved from entry. If you're already near the first resistance, most of the move has happened — the reward left doesn't justify the same risk, so consider skipping or waiting for the next setup.
SAMPLE RECORD
What every signal looks like, logged
A sample of how each published signal is tracked — entry, stop, target, and exit — as of August 18. Subscribers get the full record as it updates.
| Date | Ticker | Entry | Stop | Target | Exit |
|---|---|---|---|---|---|
| Aug 16 | ALAB | 324 | 275 | 367 | 450 |
| Aug 16 | ABBV | 250 | 242 | 261 | 282.6 |
| Aug 18 | ECL | Support Bounce | 272.8 | 281.2 | 295.3 |
Figures reflect the signal as published, not a verified brokerage account. Not every setup will work.
RISKS & FAQ
What can go wrong
A stretch to the channel edge can mark the start of a stronger move, not a reversal. Stops reduce but don't eliminate risk. Price can gap through a planned level. An entry may never trigger.
FAQ
Is this financial advice? No. Research and signal information for educational purposes only, not a recommendation to buy or sell.
Does it trade automatically? No. You decide.
Is there a signal every day? No. Only when a setup actually forms at the channel's lower band.
Where does it arrive? In the same email as your Zara brief.
Is it the same as Zara's other strategies? No. Regression Channel is built for trending markets; it's a different mechanism from Zara's other setups.
What does "free while early" mean? Free through (at least) November, 30 2026, while the live record develops.